Today we have very good features it will help us in our daily work (Performance troubleshooting and for the debugging of queries) as we know to tune any SQL Server query you should Check first the Execution plan to decide from where the problem from SQL Server 2005 to SQL Server 2014 we have two types of Execution plan:
- Estimated Execution Plan: Giving you an idea of how SQL Server will most likely perform query execution
- Actual Execution Plan : This will show you things that might hint at “out-of-date” statistics etc. But to get this, you must run the query – which can take a long time.
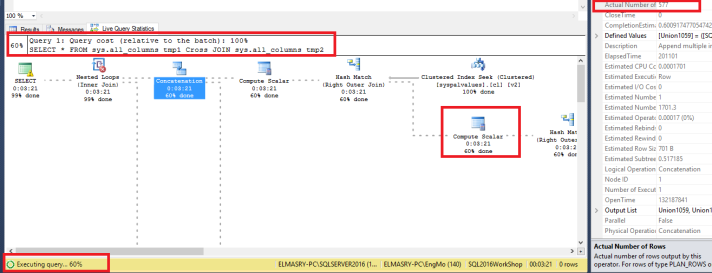
So before if we have case one Query returned Millions of record and we need to check the Query execution plan for it we will go directly for the Estimated Execution plan because actual Execution plan if we need to see it we will wait more time to the query finish and return all the result but Now in SQL Server 2016 we have new Execution plan type ” Live Query Statistics ” this new features it will he;p us to see the Execution plan when the Query running and the Effect of the Query on the Execution plan step by step from more points:
- Execution Query Percentage
- Actual Number of Rows
- elapsed time
- operator progress
What I use here in my demo is simple Query return more than 8 Millions of records if I wait for this query to return all this data to see the Actual Execution plan I will wait around 20 Minutes but now in SQL Server 2016 I will See the Execution plan the Actual Execution Plan Live with Live Query Statistics
SELECT *
FROM sys.all_columns tmp1
Cross JOIN sys.all_columns tmp2
To know More about new feature in SQL Server 2016 Keep following us and to check the previous posts in SQL Server 20116 you can check it from HERE


