In the first PART we talked about the built-in tools in SQL Server management studio and some other custom packages scripts can help us in troubleshooting performance issues, but what we can do if these tools did not support us by what we expecting and we need more information for more investigation, Most of us in the critical cases we will open case wit Microsoft support, and the first thing Microsoft engineer do it, is collecting the data during the issue, to be able to analysis it and today in this part we will cover the tools that are used by Microsoft engineers for collecting the data such as PSSDIAG tool and the upcoming part No 3 we will talk about the tools used for analyzing the output results of PSSDIAG tool such as (SQL Nexus, Performance Analysis of Logs (PAL))
All Parts (Part 1, Part 2, Part 3, Part 4)

What is the PSSDIAG tool
It is free tools used by all of Microsoft engineers for collecting most of the logs and information during the performance issue and this tool will capture all of the information related to SQL Server, IO, CPU, Network, Disks, Server Configuration, VM, and Server Configuration, and the current version release for PSSDIAG tool is 15.0.0001.12 that is supported SQL Server 2017 and 2019 versions, You can download it from here and for more information about the tool check this link on GitHub.
PSSDIAG Installation
Before installing the PSSDIAG tool make sure you installed .Net Framework 4.5, then extract the download files, and click on DiagManager.exe it will open for you screen like below
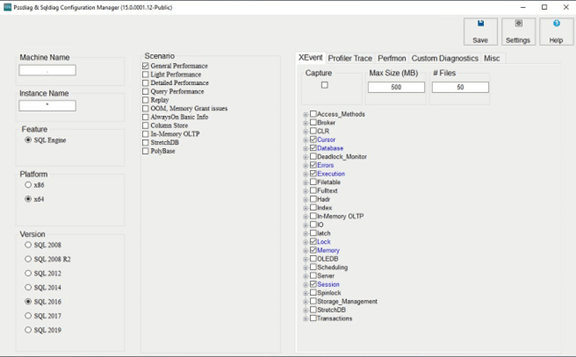
After that you need to configure your PSSDIAG package, by writing the machine, instance name, platform version, and SQL Server version, then you need to select the scenario and these scenarios changed based on the SQL Server version you will select it but in the most cases you can select between (General and Light) this link can help you for more information about creating PSSDIAG Package. After customizing the package save it and take a copy from it to the server to have the performance issue and make sure you add this package in disk with enough free space because the output of the PSSDIAG will be saved inside the same folder of the package.
After that all what you need to do to open CMD or PowerShell as admin and call the package from the location you saved on it, or you can run this file(pssdiag.cmd) that is exists inside the PSSDIAG package and keep it running for a maximum one hour why one hour because SQL Nexus in some reports cannot be generated when the data collected for more than one hour.
When you need to stop the PSSDIAG collection just do PRESS CTRL+C
Add in your note when you execute the PSSDIAG package it will create an Extended event on your SQL Server by name pssdiag_xevent make sure it is running and after stopping the package disable this extended event.
BPCheck Script
BPCheck script is a stored procedure created by the SQL Tiger team used for collecting all of the server information and configuration, you will need to execute it to share it with Microsoft engineer to have a full vision about the server configuration, even if you are doing this troubleshooting by your self this script will be helpful to give you the current configuration for your server and what is the recommendation.
For more information about the Script ( what the script contain, How you can execute it, What is the other versions from it like the PowerShell version, Azure Data Studio notebook version) check this link
The result of these scripts will be saved on file with extenuation. RPT and you open it you can use for example (Note Pad ++, VSCode tool)
Keep Following
Cloud Tech Website blog survey
IF you found this blog is helpful and sharing useful content please take few second to do rate the website blog from here
