Introduction
Most of us as DBA (Database administrators) have the base knowledge about the performance issues, and during our work days we faced many of performance issues, and I believe that troubleshooting performance issues is something not easy and not straightforward so there is no documented steps for How you can troubleshoot the performance issue because the troubleshooting depend on the type of the performance issue but most of the technical support teams used some common tools and scripts for troubleshooting performance issues, and the most important thing that you should build your own scripts library that can help you for troubleshooting the most common cases of Performance issues such as (Locking and Blocking on Database, High CPU , Timeout, Slowness , …etc) So my advice Start to build your own library and try to be more proactive and don’t waited the issue come to you , try to find it before it is fire, in this article of today I will try to explain some tools and scripts can help you while troubleshooting any performance issues and this tools used by the most expert guys and some of them used by Microsoft technical Support team.
This article for how to capture the workload during the performance issue to be able to know what the issue is but not for how to solve this issue.
If you have any other helpful tools or scripts not mentioned here and it can help for troubleshooting the performance issue share it in the comment to be the article as a repository for all of us.
Check the other parts (Part 2, Part 3, Part 4)

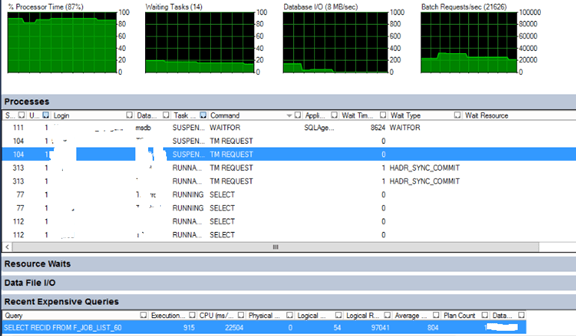
SQL Server Activity Monitor
Built-in tool in SQL Server it can give you visibility about the list of queries running on your server on the same time, with this tool you can know the looking sessions, blocking session, High CPU query, Long running a query, and much other information
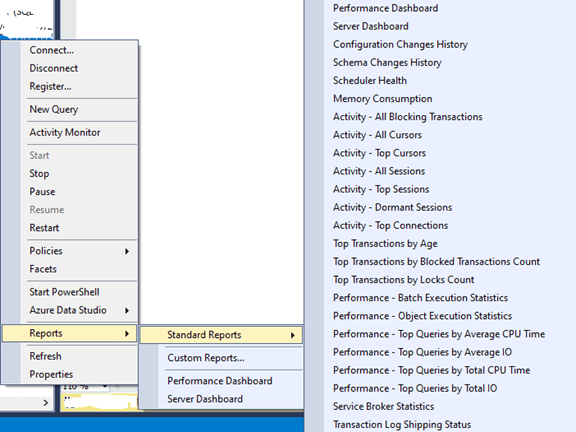
Performance Dashboard Report
Very helpful report built-in in SQL Server management studio in the latest versions, It gives you a complete vision about the server health status, to find it Right-click on the SQL Server instance name from SSMS > Reports > Stander Reports > Performance Dashboard, If you are using old SSSM version and this not recommended but in case you can download this report from here and import it on your SQL Server management studio and import this report ( Right-click on the SQL Server instance name > Reports, Custom Report > then select the report you download it from the link)

SQL Server Built-in Reports
Inside the SQL Server management studio there are many other reports you can use it to collect much other information’s can help you in the troubleshooting and investigation process for the performance issue.
Brent ozar first responder kit
Brent developed Free Scripts it can give you full information and health check about your SQL Server Such as (sp_BlitzCache, sp_BlitzIndex, sp_BlitzLock, sp_BlitzWho) and many other scripts in his library it is full free trial to check it from here and he already does many of sessions and record videos for How to use it Just google it you find more videos can teach you How and When to use these scripts.

Keep Following
Cloud Tech Website blog survey
IF you found this blog is helpful and sharing useful content please take few second to do rate the website blog from here
