If you don’t read the previous parts you can read it from here (PART1, PART2), in this part of today we will explain how we can analyze the output of PSSDIAG using:
- SQL Nexus
- SQL-Nexus-and-ReadTrace-Analysis-Scripts
- Performance Analysis of Logs (PAL)
in the previous part we explained how we can collect the most sensitive information and logs during the performance issue using PSSDIAG and today we will take the output of PSSIDAG and we will analyze it using SQL Nexus
All Parts (Part 1, Part 2, Part 3, Part 4)

What is SQL Nexus
SQL Nexus graphical tool used to analyze the output results of the PSSDIAG and it can help us for identifying the root cause of the SQL Server performance issue for more information about the tool check this link
SQL Nexus Requirements
- You need to install SQL Server Management Studio Version 2016 or later.
- You need to install CLR Types and Report Viewer and both are features in SQL Server 2016, you can download and install them from here.
- You need to install RML Utility you can download and install it from here.
- Finally, you need to download and install the SQL Nexus latest version (6.0.0.8) Check this link.
Start loading and Analyzing the PSSDIAG output
Now after SQL Nexus installation and the other requirements you need to open it and import the PSSDIAG output, when you open it you should screen like below and the tool will ask you to connect to SQL Server instance because the tool will create a database to save the results of the analyzing on this database.

Now you need to click on Import and select the PSSDIAG output then SQL Nexus will start to load and analyze the output
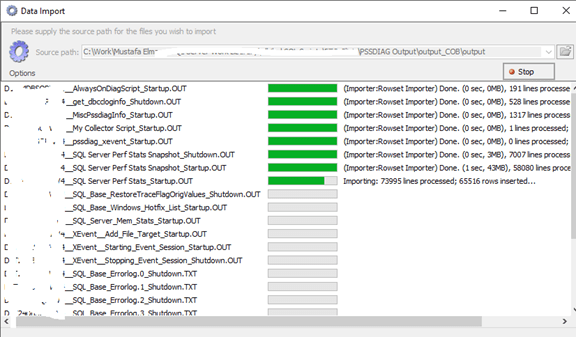
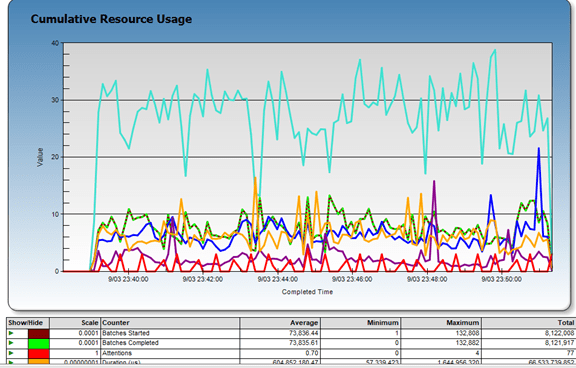
After the loading the tool will generate for you many reports that can help you to troubleshoot and investigate on the server logs captured during the issue, to know where the root cause is
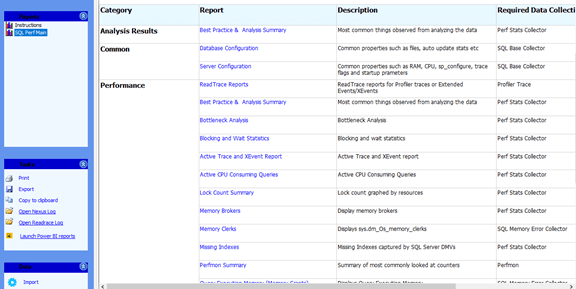
The most important report you need to check it first is Read Trace Reports
SQL-Nexus-and-ReadTrace-Analysis-Scripts
As we mentioned that the SQL-Nexus created one Database and it will save all of the analysis information on it, and if you need to get more information not exist in the SQL Nexus GUI Reports you can run your queries on this database or you can use two scripts customized by SQL Tiger to download these scripts check this link.
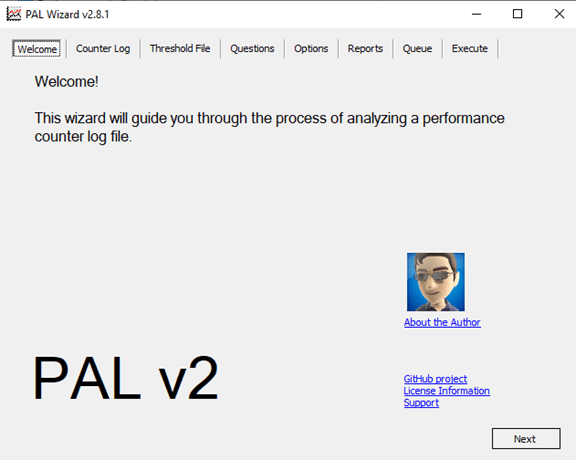
Performance Analysis of Logs (PAL)
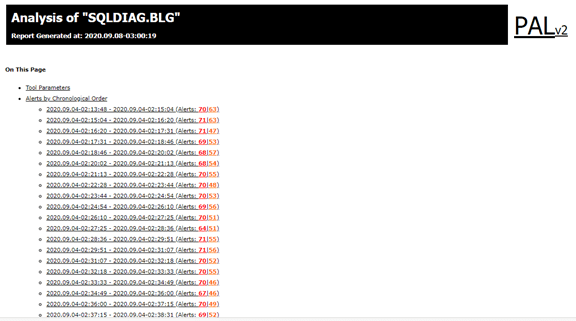
This tool used to analyze the performance monitor counter log collected by PSSDIAG, If you open the output folder of the PSSDIAG you will find at the end of files one file with the name (SQLDIAG.BLG) this file you need to import it into the PAL tool (PALWizard.exe) and the PAL tool will generate output results as htm report, You can download PAL tools version (PAL 2.8.1) from here and for more information about PAL tool check this link
Keep Following
Cloud Tech Website blog survey
IF you found this blog is helpful and sharing useful content please take few second to do rate the website blog from here
