SQL Server Torn Page Repair: Without Worrying About Data Loss or Corruption


It can often be bugs and errors in fetching data from the server. This can leave system administrators baffled as all work comes to a standstill. Incomplete or incorrect transaction cause confusion among employees working on the different sections of a database.

One such frequent issue is the SQL Server torn page error. It can be quite a hassle for a non-technical user facing such a situation. There are ways to fix it easily without worrying about any data loss. This post covers all there is to know about this topic. Continue reading to find out more.

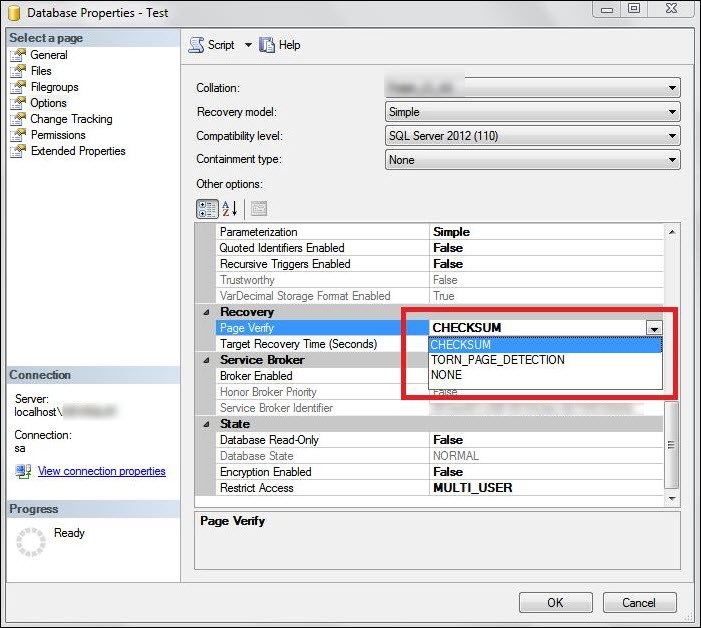
What is the Torn Page in SQL Server?

It is the inability of the server to fetch a particular data during a transaction. It is caused when an Input/Output header tries to access a page that was written incorrectly to the disk. It reports a message saying ‘I/O error (torn page) detected during read’. The reason for this can be primarily contributed to power failure causing partial writes. Other factors include damaged disk or other hardware to which data is being written to. If a torn page is detected by SQL Server, it will sever all connections as the requested data is inaccessible. During the restore process, detecting a torn page sends the database into SUSPECT mode.

sql server torn page repair

Continue reading “SQL Server Torn Page Repair: Without Worrying About Data Loss or Corruption”

Query Store for Solving Query Performance Regressions


Query performance is a very important area of SQL server. We always have badly performance queries around.

Query store is the newest tool for tracking and resolving performance problems in SQL server.

In this article, we are going to have a look at some practical uses of SQL server Query store.

What is Query Store?

The query store has been described by Microsoft as a ‘flight data recorder’ for SQL server queries. It tracks the queries run against the database, recording the details of the queries and their plans and their runtime characteristics. Query store is per database feature and runs automatically. Once turned on, nothing further needs to be done to get it to track data. It runs in the background collecting data and storing it for later analysis.

Query store is available in SQL Server 2016 and later, and Azure SQLDB v12 and later. It is available in all editions of SQL server, even in Express edition.

How is Query store different from other tracking options?

We have had query performance tracking for some time though in the form of dynamic management views. Mostly, sys.dm_exec_query_stats and sys.dm_exec_query_plan and tracing tools like SQL server profiler and extended events.

So, what makes Query Store different? Let me start answering that by describing a scenario that I encountered a couple of years ago.

A particular critical system was suddenly performing badly. It had been fine the previous week and there have been no extended events sessions or profiler traces running historically. The admin had restarted the server when the performance problem started, just to make sure it was not something related to a pending reboot.

As such, there was no historical performance data at all and solving the problem of what happened, why the query performance is different this week was extremely difficult.

1

Continue reading “Query Store for Solving Query Performance Regressions”

Improve SQL Server Performance with Compression


SQL Server data compression is now available in all editions of SQL Server, starting with 2016 SP1.

In this Article, you will not only know how data compression will save space, you’ll also find out how compression can sometimes improve performance as well.

Space Savings vs. Performance

When I first heard about compression back in 2008, my first thought is that it would have a big performance penalty. Compression would save disk space, but it would probably decrease performance as the data was compressed and decompressed. It turns out that compression can improve performance instead. Because compressed data fits in a smaller number of data pages, there are decreased I/O requirements. Since I/O is generally the bottleneck in SQL Server, this can improve performance. Compressed data also has a decreased memory requirement. When querying compressed data, a smaller number of pages will be copied to the buffer pool. The one area that is impacted is CPU. You do need to have some CPU headroom because compression will require some additional CPU resources.

a1

The good thing is that if the workload is reasonably tuned, many SQL Server instances have more CPU resources than they need. One note of caution here. Don’t look to compression as the solution to solving major performance issues. You need to look at physical resources, configuration, indexing, and query tuning. The point I’m trying to make is that decreased I/O and better memory utilization will benefit the workload in many cases.

Continue reading “Improve SQL Server Performance with Compression”

SQL Server performance – measure Disk Response Time


Introduction

As DBAs, we all get to the point where we are asked to setup a new server for a particular environment. Setting up a new server is not a big thing but giving the answer to the question that “how well it will work” might be tricky.

There are tons of items which we can set up to measure how well the newly installed server will receive a response, but here I will discuss one of the most valuable resources of the server “Disk.” Most often the disk is not measured correctly, or I have seen environments where the disk response time has never been measured. I will discuss here a tool from Microsoft which is very handy and can solve your problem very quickly. The diskspd.exe!

It’s the superseding version of SQLIO which was previously used to measure IO response time for the disk. The source code of diskspd.exe is hosted on GitHub. You can download this free utility from Microsoft’s website using this link.

After you download the utility, you will get a zip file. Just unzip the file, and it will give you the folders and files as shown in the below screenshot. You will-will need the eye of diskspd inside the folder “amd64fre” if you have a SQL Server 64-bit version (most of us will be having this).

To complete this article please check it here


word-image-29

Changing @@SERVERNAME causes SQL Server Backups to Fail for AlwaysOn Availability Group


One of customers changed the value returned from @@SERVERNAME.  SQL Server works no problem, however an unexpected behavior appeared.  Changing the value for @@SERVERNAME, caused the backups to fail.

Looking at the maintenance jobs, found all jobs completed successfully and without issues.  However, upon looking at the database’s statics it states no backups completed.

image

Because the database in question is part of AlwaysOn Availability Group (AG); SQL Server executes sys.fn_hadr_backup_is_preferred_replica to determine if the backup should take place on the current node.  However, it returns value of 0 for all databases, if the preferred replica is set.  Because, the script makes a check that is running on the server that is preferred.  It does this by comparing the value to @@SERVERNAME to value of replica_server_name in sys.availability_replicas.  Because value will never match, it skips the database on both primary and secondary replica.

I have created a Microsoft Connect article (link); asking this little bit of information to be added to Books Online article (link).  There was a request submitted by Ola Hallengren (Blog | Twitter), which was closed as Won’t Fix (link).   Please vote!

This post is cross posted on my SQLCAN Blog, MSDN Blog, and SQL server Consultation blog.